

Firefly is a web application that allows users to interactively explore their 3D particle data. At its core, it is a Javascript app that uses WebGL to efficiently render millions of particles in an interactive three.js scene. In addition to traditional static html and css, the user interface is procedurally generated using d3.js according to a configuration file, allowing visualization creators to ship different versions of their visualization for different audiences without changing the underlying code or data. On top of this framework, we provide a python frontend that allows users to generate their own Firefly visualizations and host virtual webservers using Flask, enabling users to control their visualization via a remote device (i.e. an iPad), livestream the output of their visualization from a remote server (like a supercomputing cluster), or load new data directly from a Python interpreter without having to read it in from disk.
Hover over a thumbnail for a description of each Firefly instance and click the title to try it out yourself!
Alex Gurvich
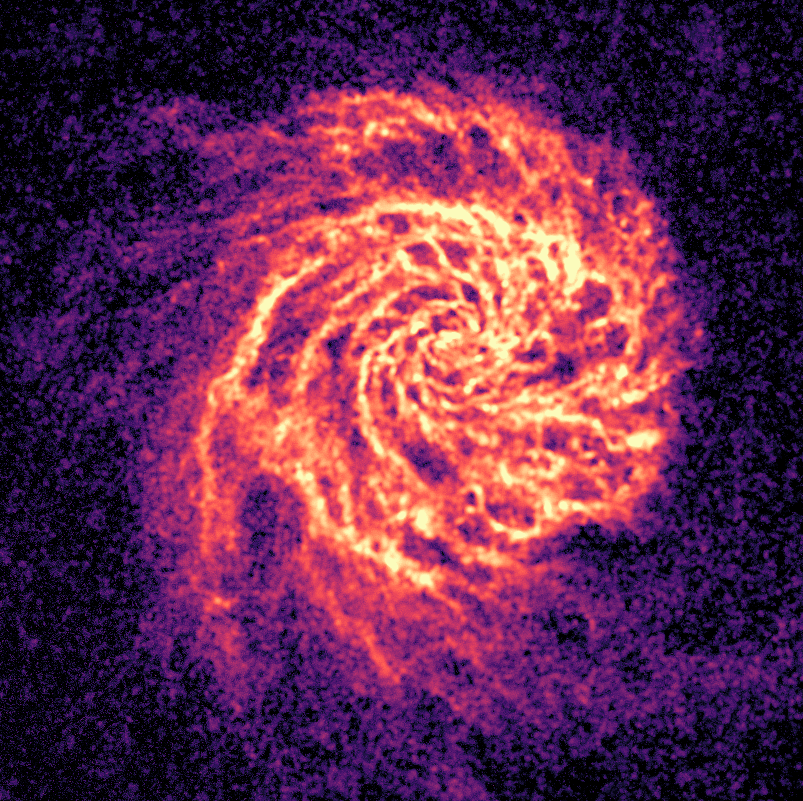
In this example from the FIRE galaxy formation simulations we use the 2D histogram rendering mode to emphasize the surface density contrast of points making the spiral structure of the disk.
Alex Gurvich
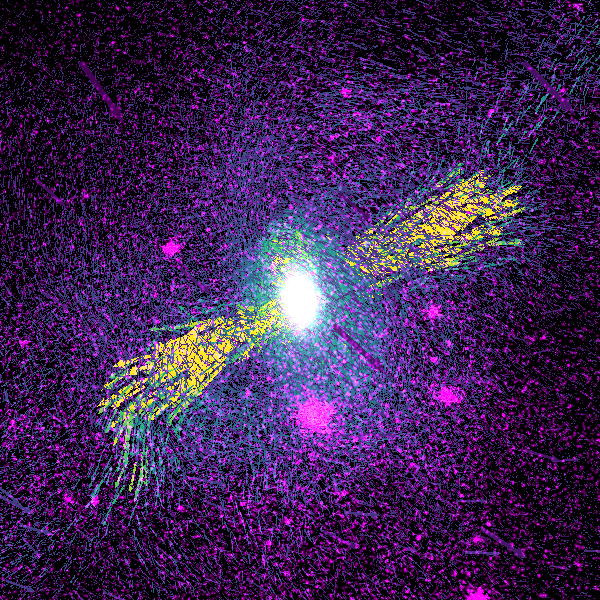
In this example from the FIRE galaxy formation simulations we use velocity vectors and color by temperature to emphasize hot outflows from the center of the galaxy. This is our default dataset that we recommend trying first as it is the most stable!
Alex Gurvich
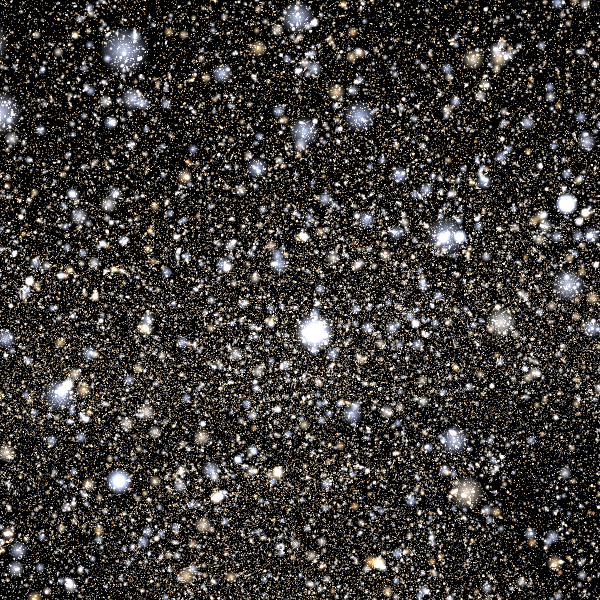
In this example, we use data from the Gaia space telescope collaboration to visualize the real-life positions and velocities of stars in the Milky Way.
Alex Gurvich
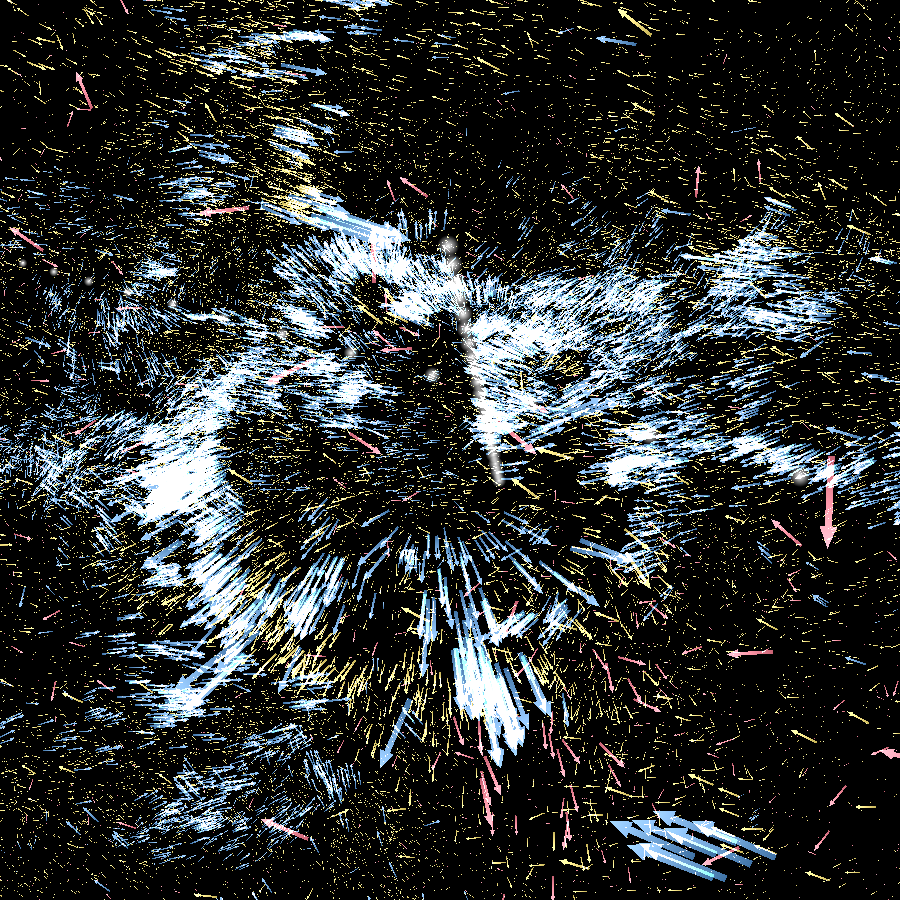
In this example, we demonstrate how to select between multiple datasets at different times. The data here shows the formation and growth of a galactic disk from an initial chaotic system.
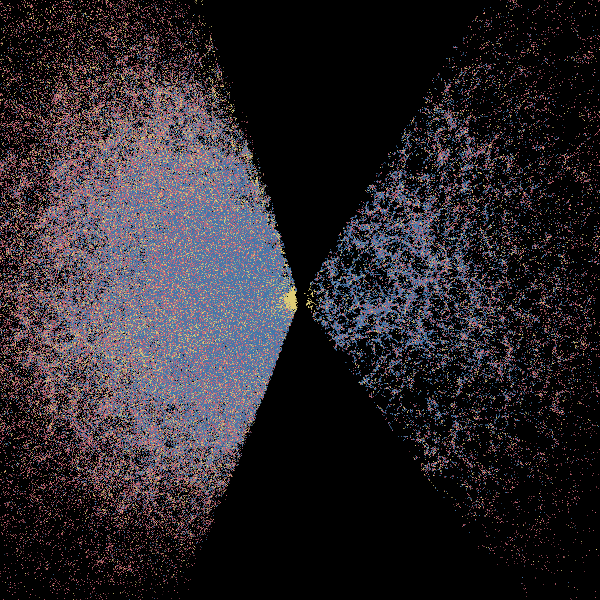
Alex Gurvich
In this example using data from the Sloan telescope collaboration we visualize the real-life positions of galaxies colored by their classifications according to the citizen science project Galaxy Zoo.
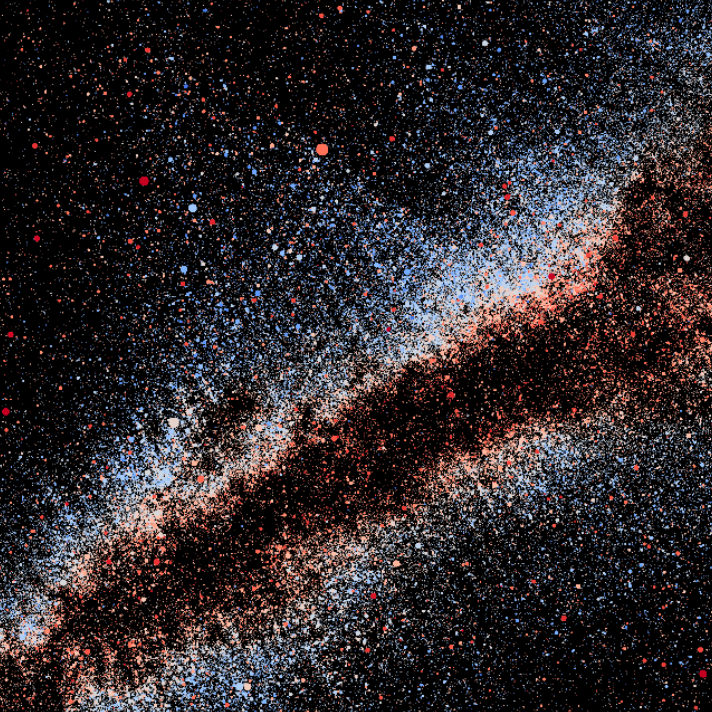
Alex Gurvich & Aaron Geller
In this example, we showcase the powerful octree rendering engine which progressively loads as the camera moves. To our knowledge, this is the only interactive visualization of the full 1.5 billion point dataset from the Gaia telescope DR3 data release.
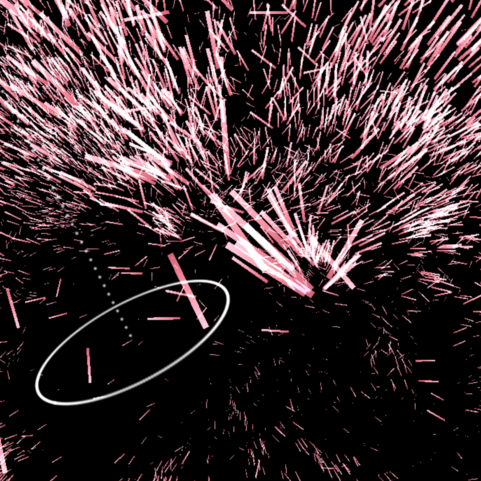
Zach Hafen
In this example using an older version of Firefly, time series are visualized by including data from all the output times from the simulation. Data is classified and colored by where it will end up in the future.
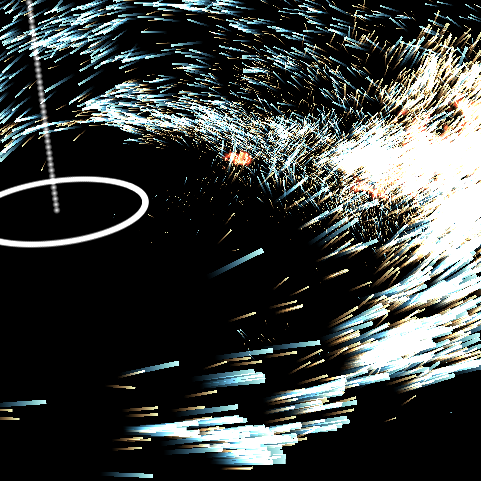
Zach Hafen
In this example using an older version of Firefly, time series are visualized by including data from all the output times from the simulation. Data is classified and colored by where it came from in the past.